
Your users are already telling you what to fix.
Tugboat turns sessions, metrics, crashes, and revenue into an action plan: what to fix, what to ignore, who should own it, and whether yesterday’s fix worked.
Map your appSessions in
Decisions out
Every interaction becomes evidence.
Tugboat turns evidence into prioritized actions.
Watch. Diagnose. Ship.
Tugboat connects sessions, metrics, crashes, campaigns, and revenue to find what is blocking product growth, then turns the highest-impact issues into tickets, experiments, fixes, and measurable outcomes.
Finds the signals humans miss.
- ›User sessions, rage taps, dead taps
- ›Funnel drops and retention changes
- ›Crashes, latency, API failures
- ›Campaign and attribution shifts
- ›Revenue leaks and paywall failures
Turns sessions into actionable insight.
- ›Ranked by business impact
- ›Root cause and confidence score
- ›Affected users and segments
- ›Session evidence attached
- ›Tailwinds to double down on, headwinds to fix
Moves the team to action.
- ›Create Linear/Jira tickets
- ›Assign owners
- ›Generate PR prompts
- ›Create experiment plans
- ›Measure if the fix worked
Your stack is full of answers. Just not the ones you need.
Pull evidence from analytics, support, revenue, logs, and product sessions. Tugboat connects the fragments and tells your team what matters.
Your analytics tools
Bring events, funnels, cohorts, and activation data from tools like Amplitude, PostHog, Mixpanel, and Firebase.
Your ticket systems
Connect support conversations, bug reports, churn reasons, and customer complaints from Intercom, Zendesk, Linear, and Jira.
Your OKR dashboards
Tie every issue to activation, retention, conversion, revenue, ARPU, or LTV so teams fix what matters.
An employee
that never
sleeps.
Tailwind detected: Logo users convert 2.1x
Campaign mismatch found
Activation drop detected: Export harder to reach
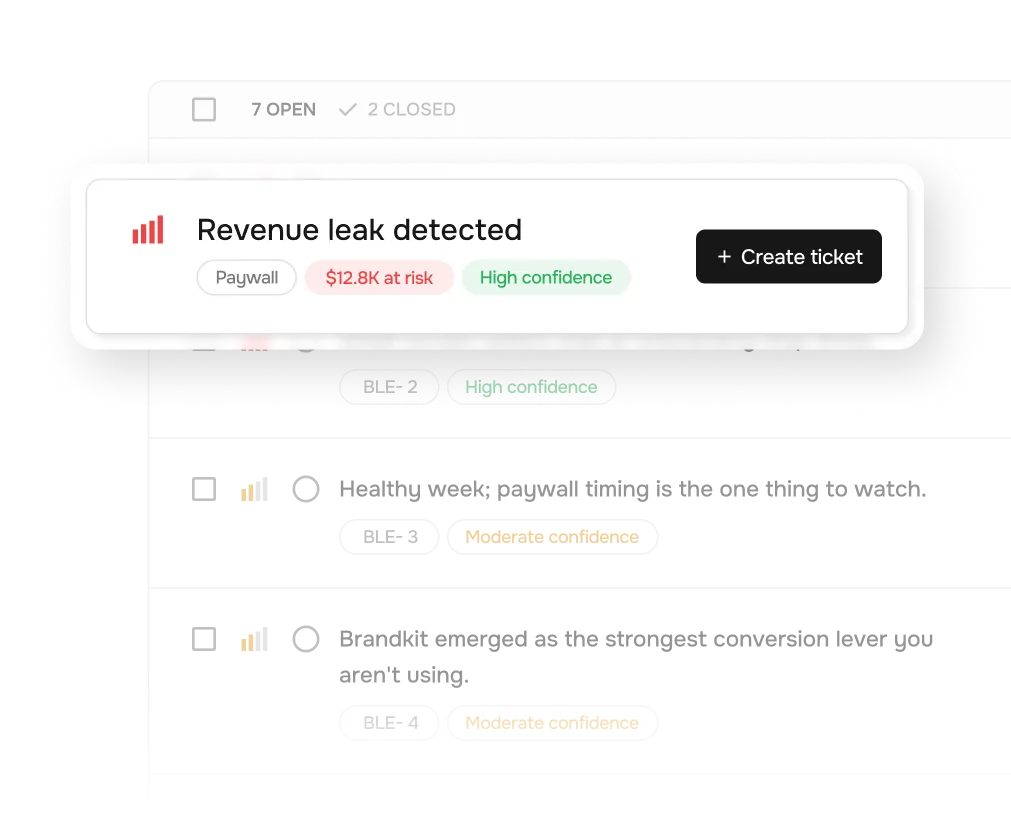
Revenue leak detected
Release regression found
Tailwind detected: Logo users convert 2.1x
Campaign mismatch found
Activation drop detected: Export harder to reach
Revenue leak detected
Release regression found
Your whole product team.
One source of truth.
Hit your OKRs.
Not your guess list.
Tugboat tells you which product changes will move activation, conversion, and retention the most, ranked by evidence, not instinct.
- ·Ranked list of what's blocking your activation OKR, updated weekly
- ·Each finding linked to funnel impact and user evidence
- ·Confidence scores based on session volume and signal quality
- ·Suggested experiments with expected impact ranges
- ·Direct line from insight to Jira ticket, no manual write-up
Session evidence,
already synthesized.
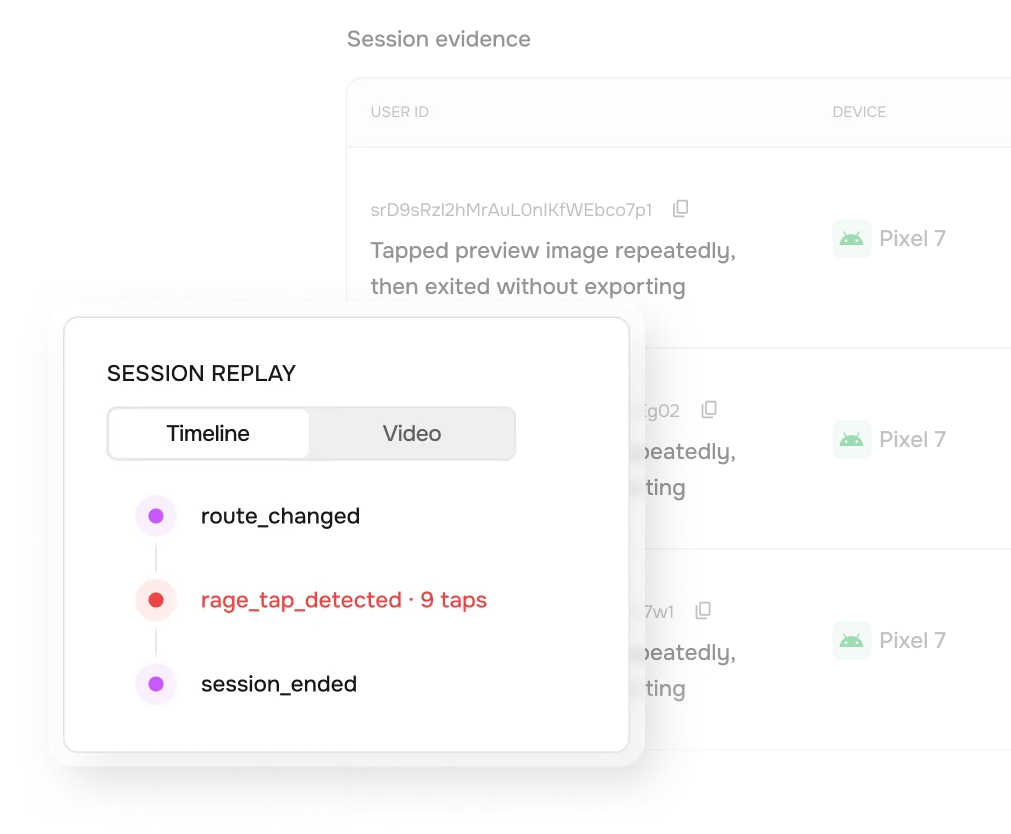
Stop manually tagging session recordings. Tugboat clusters confusion patterns across thousands of sessions and gives you themed findings with clips.
- ·Confusion themes grouped from session behavior, not self-reporting
- ·Rage tap and dead tap maps per screen
- ·Session clips linked to each confusion cluster
- ·Copy clarity analysis across onboarding flows
- ·Usability friction taxonomy updated every 24 hours
Technical root cause.
Not just symptoms.
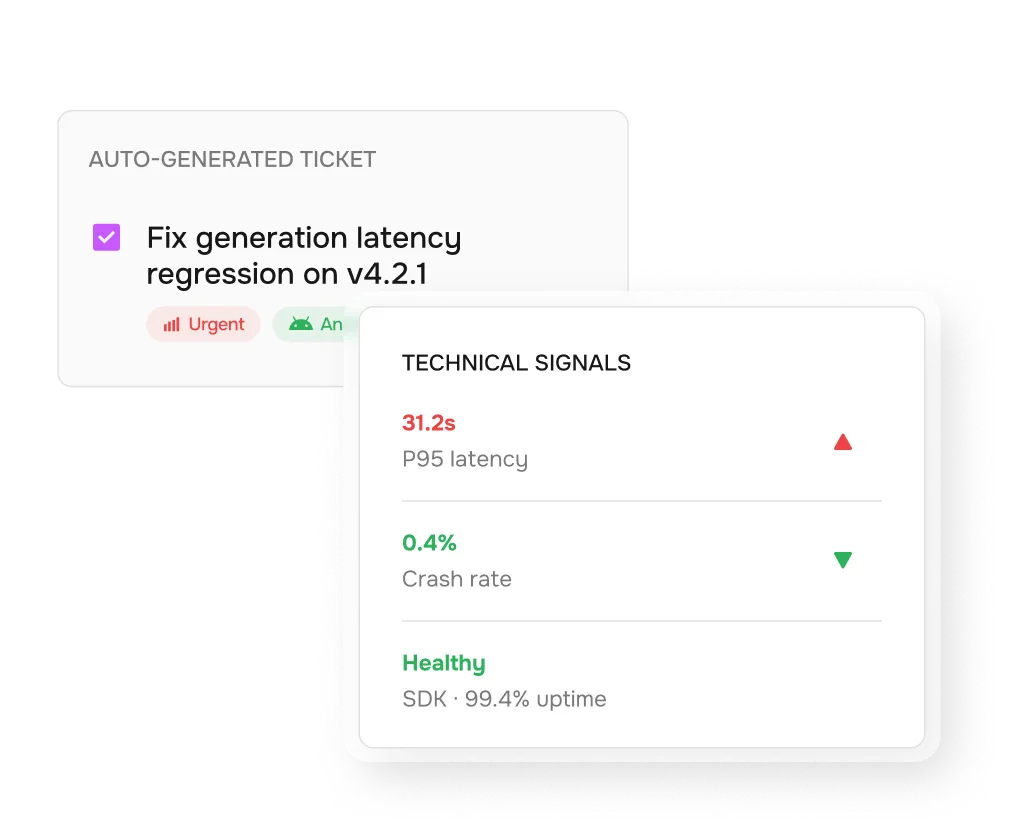
Tugboat correlates user confusion with technical signals, API latency, crash rates, SDK health, so engineers know exactly where to dig.
- ·SDK health dashboard with first-session detection latency
- ·API error correlation mapped to user drop-off moments
- ·P95/P99 latency per critical user action
- ·Release correlation: did the last deploy change anything?
- ·Auto-generated engineering tickets with full technical context
The questions PMs ask at 9am.
Tugboat answers by 8.
Tugboat doesn't need another workflow.
It joins the ones you already have.

Build products that improve themselves.
Give your team the context layer between users, metrics, tickets, revenue, and engineering.