
Your Analytics Tool Is A Data Warehouse With Better Branding
Amplitude, PostHog and Mixpanel wait for you to ask the right question. Tugboat goes looking for the answer.
 By Simra Sadaf · Content Writer10 sections
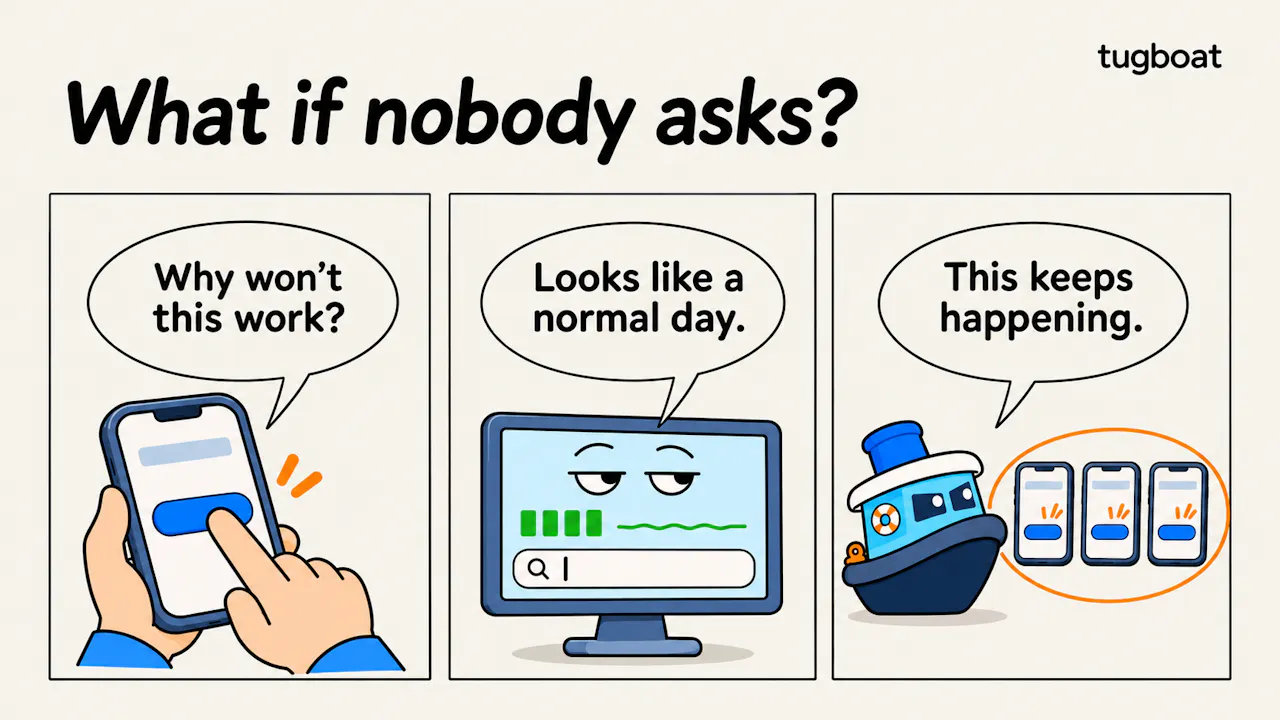
Most product teams set up their analytics the same way. You pick an event tracker (Mixpanel, Amplitude, PostHog, take your pick) and then spend a few weeks arguing about event names, tagging buttons and logging screen states. When it's done, you have a dashboard full of funnels and bar charts that gets pulled up at the weekly product meeting.
One week, onboarding drop-offs suddenly increase by 14%. The team knows something is wrong, but the dashboard doesn't explain why. They open their dashboard and start pulling levers, trying to find out what went wrong. They filter by OS version, run cohort comparisons, and set up ad hoc meetings to understand what changed.
Most analytics tools are just a data warehouse with better branding.
Traditional analytics platforms do not discover why software breaks. They are visual SQL wrappers sitting on top of an event log. They sit there until someone has a hunch and writes the query. If you don’t already suspect what’s wrong, your analytics tools will never tell you about it.
Same Machine, Nicer Controls
Funnels, cohorts, retention curves, event counts: every one of them is a saved question. "How many of those who started checkout actually completed it? "Of the signups we got last month, who is still using the app?”. These questions can be answered by both: an analytics layer and a warehouse. What the analytics layer adds is convenience. Nobody has to write SQL by hand.
Convenience matters, but it doesn't change where the thinking happens. Follow the path from start to finish:
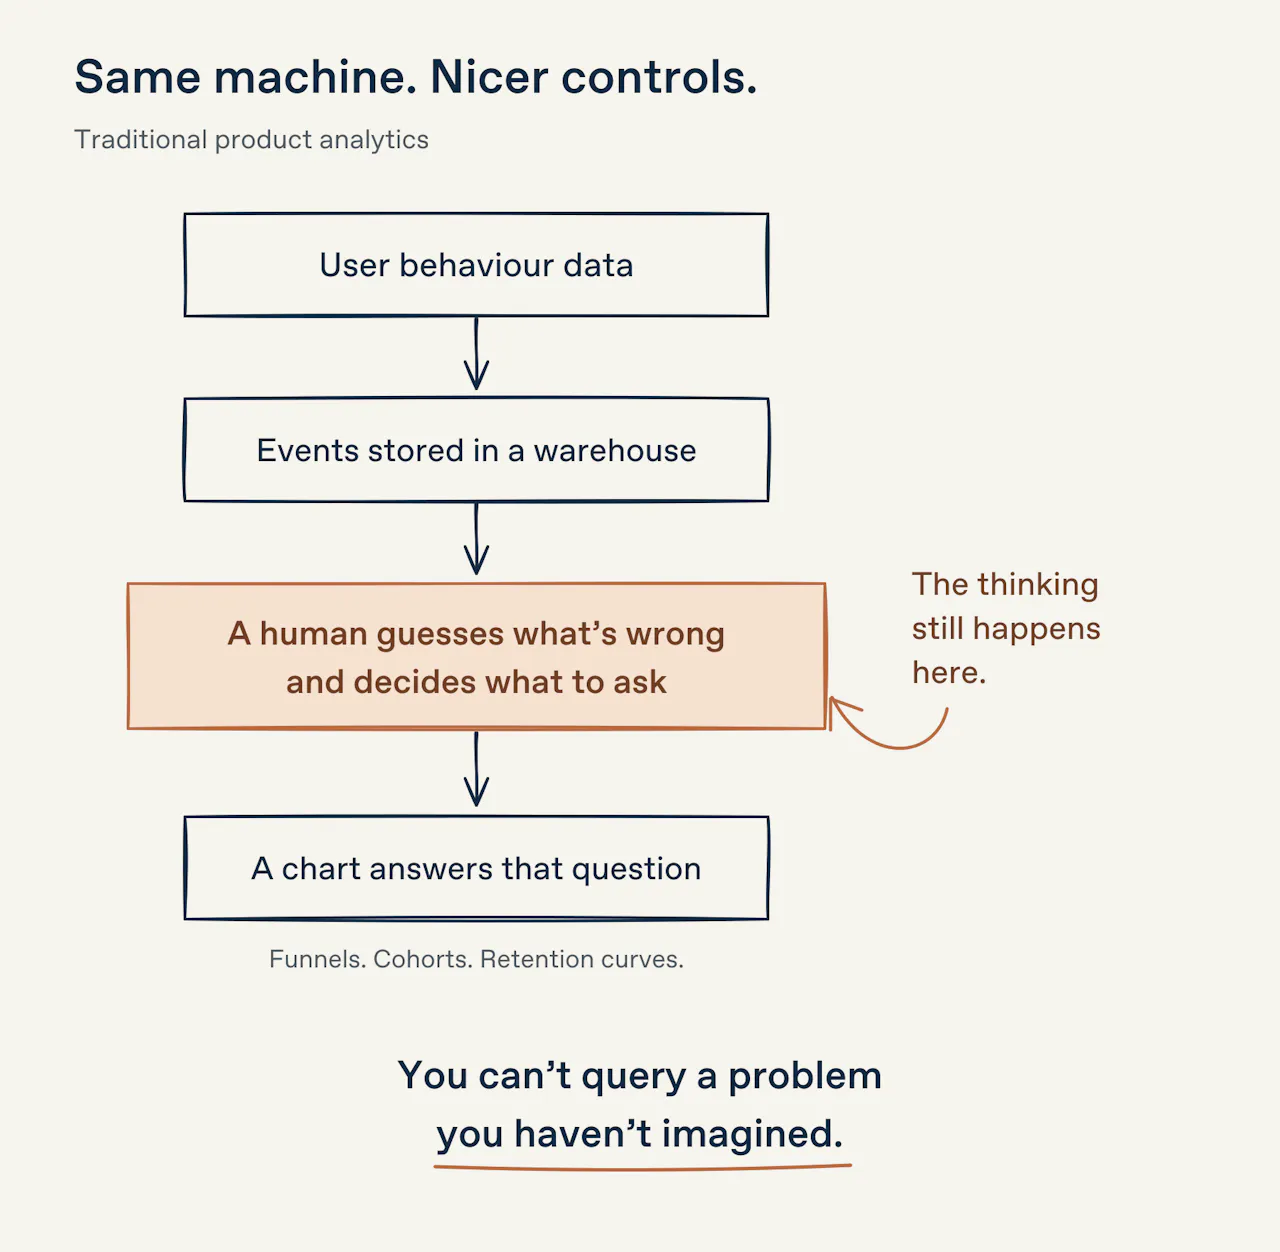
Every step is automated except the one that determines whether you find anything at all.
This step has a flaw though. How can you write a query for a problem you haven't imagined yet? You can't slice a funnel by a bug you don't know exists. It answers whatever you ask. It can’t tell you what you should have asked.
The output has a limit of its own. Analytics data offers you with the number of hard successes and hard failure metrics, such as, sign-ups, paid users, errors. That's important and it's also the low-hanging fruit of user research.
How Do We Attempt to Solve It?
When product teams see that the static dashboards they've built don't tell them why metrics are falling, they usually try to address the discovery challenge through these common approaches:
Approach 1: Throw AI at the Warehouse
"Let's load all our data into an AI prompt."
Let’s say you dump a huge amount of raw telemetry into an LLM thinking you will find what you are looking for. Sadly, AI fails to process the data effectively. It might flag a random metric spike or an odd edge case, but there's not enough context or evidence to follow up.
Approach 2: Watch User Sessions
"Let's just focus on user sessions to see what is happening."
It is almost impossible to watch every recording. Plus, paying an AI to watch them all can be expensive. Even if you did manage it, you will be left with a pile of recordings that may not be significant.
Approach 3: Add AI to the analytics dashboard
"What if we just built AI directly into our existing analytics tools?"
Tools like Amplitude are deploying AI features which allow data searches, cohort comparisons, and report generation without the need to write SQL code. This could make the process move faster. But the catch is that the tool is still waiting for you to manually notice.
Even though AI support systems provide easier access to inquiries, they still don't decide which questions need to be flagged. Someone on your team still has to notice a drop. Then, suspect a cause and prompt the AI to investigate.
All three methods are ineffective. Just like dashboards, they supply more data but leave decision-making to the user.
A Better Approach: How Tugboat Solves It
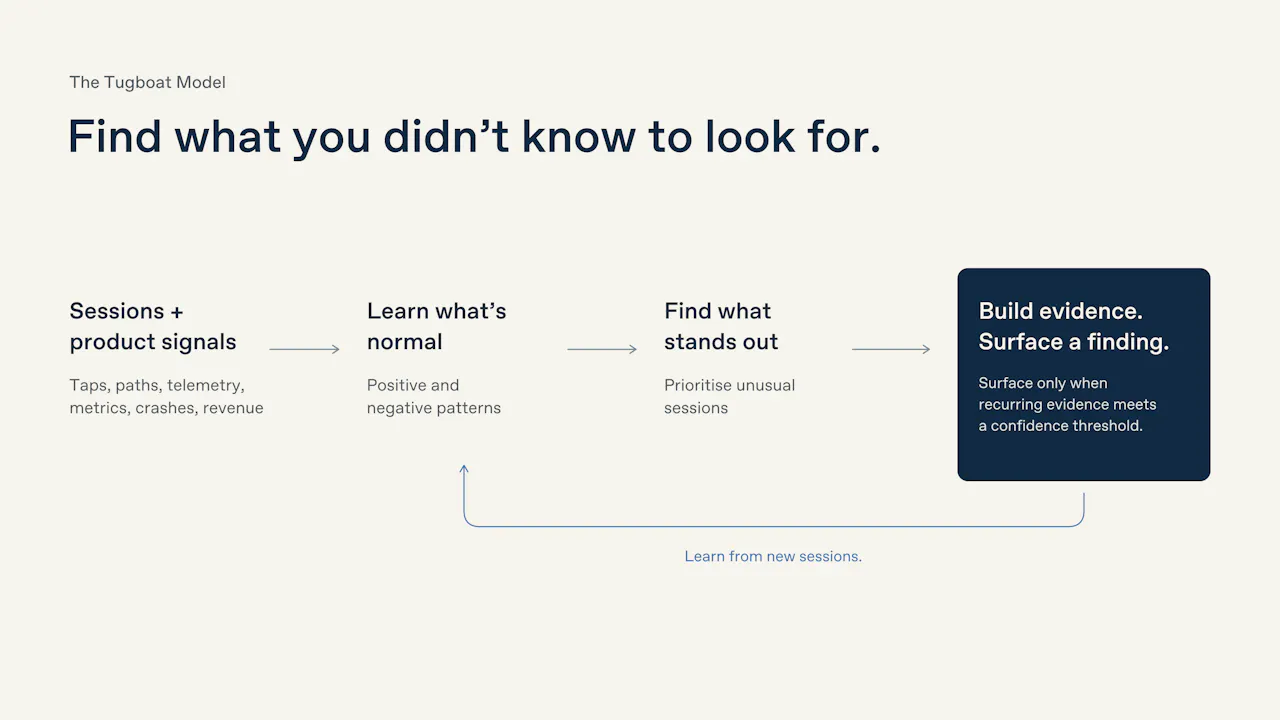
Tugboat turns sessions, metrics, crashes and revenue into a clear action plan for product teams. The way it gets there is deliberately different from the two approaches above. It doesn't dump everything into one prompt. Nor does it ask anyone to sit through every recording. Instead, it builds up evidence over time instead.
- Mapping baseline behavior: Tugboat watches an initial batch of sessions to pick up the patterns of positive and negative behavior in your product.
- Ranked session scanning: Using that baseline, it ranks later sessions and flags the stretches where behavior goes wrong. Nobody has to watch the sessions that were fine.
- Threshold-based surfacing: One strange session is an anecdote. As the same behavior keeps showing up, the evidence adds up, and once it crosses a confidence threshold, Tugboat logs the observation and points your team to what's causing it.
The threshold is the part we care about most. A tool that flags everything is just another source of noise. By waiting until the evidence is strong enough, Tugboat only brings up the things that are worth a team's time.
A Real-World Example With Blend
We recently encountered a bug in Blend, an AI-powered tool that lets people turn product photos into short ad videos. As you can see, the create screen has two tabs, Preset and Prompt. In Preset mode, voiceover is off by default. But when the user tried to open the Prompt tab, it applied that tab's defaults to both tabs: voiceover on, music, and ten seconds. Switching back to Preset kept those settings. Users who never asked for a voiceover got videos with one anyway.
Nothing crashed. There was no error to chart and no funnel step that dropped. On a dashboard, it would look like a normal day of people generating videos. To catch it, someone would have to suspect that moving between two tabs changes a setting, and then go looking for it. Nobody suspects that, and that's the point. It's the kind of bug that stays hidden because nothing about it looks broken.
It's a good example of how a seemingly minor interaction between two tabs can affect the entire user experience. You need to understand how users move between screens, how the app responds to those interactions and whether its state changes produce unexpected results.
It wasn't the only one that was surfaced by Tugboat. A few more from the same set:
A button that did nothing: While Try-On generates, tapping “Want to change something?” does nothing. There’s no error or response, so people tap again.
Two pickers that behaved differently: The color picker shows changes instantly. The background picker doesn't, so to compare photo backgrounds, users had to reopen it after every pick.
Look at what these have in common. Each one is a person doing something reasonable and getting a result that quietly fails them. Nothing registers as a failure, so nothing shows up on a chart. This is where Tugboat can help.
A Quick Test For Your Team
Think about the last three important things your team learned about your product, and ask how each one started. If the honest answer is mostly "someone had a hunch and went looking," then your analytics is working like a data warehouse. It's fast, it's reliable, and it can only answer what you've already thought to ask.
That's fine for checking an idea you already have. It's a poor way to find the things you never thought to check, and those are usually the ones actively costing you users.
Conclusion
Analytics tools aren't going anywhere, and they shouldn't. When you have a hypothesis, a fast way to test it is exactly what you want. But a dashboard can only show you what you thought to ask for, and the problems that cost you the most users tend to live outside that list.
So the real question for your team isn't which analytics tool to buy. It's who, or what, is looking for the problems nobody has suspected yet. For most teams right now, the honest answer is whoever has time that week.
We built Tugboat so that answer doesn't depend on luck. It turns your sessions, metrics, crashes and revenue into a clear action plan, so the next time a number jumps, your team starts from evidence instead of playing the guessing game.
Frequently asked questions
Do we have to remove Mixpanel, Amplitude, or PostHog to use Tugboat?+
No. Tugboat sits alongside your existing analytics stack rather than replacing it. Keep using your current tools for tracking known KPIs, executive reporting, and testing specific hypotheses. Tugboat finds bugs, friction points, and unexpected ways people use your app.
How is Tugboat different from AI query builders or "chat with your data" tools?+
Most AI analytics tools are still passive. They just translate your English prompt into SQL faster. You still have to know what to ask. Tugboat flips that workflow by actively scanning behavioral patterns on its own and alerting your team only when enough evidence builds up around a real product issue.
Won't an automated discovery tool just flood our Slack with false alarms?+
That is the exact problem our confidence threshold solves. One user rage-clicking a button or hitting a glitch is an anecdote, not an engineering ticket. Tugboat waits until a friction pattern repeats across enough sessions to cross a statistical confidence threshold before it brings the issue to your attention.
Do we need to spend weeks tagging events before Tugboat starts working?+
No. Tugboat learns by watching real user sessions and product flows rather than relying on manually instrumented event schemas or hand-written labels like paywall_screen. It recognizes screens, transitions, gestures, and taps on its own so you don't need a massive tracking plan to get value. It maps baseline behavior out of the box and starts flagging anomalies as live user traffic flows through.