
User Behavior Analytics: 12 Patterns Hidden Between Product Events
Events are not behaviour. The pattern between events is what product teams need to investigate.
 By Simra Sadaf · Content Writer5 sections
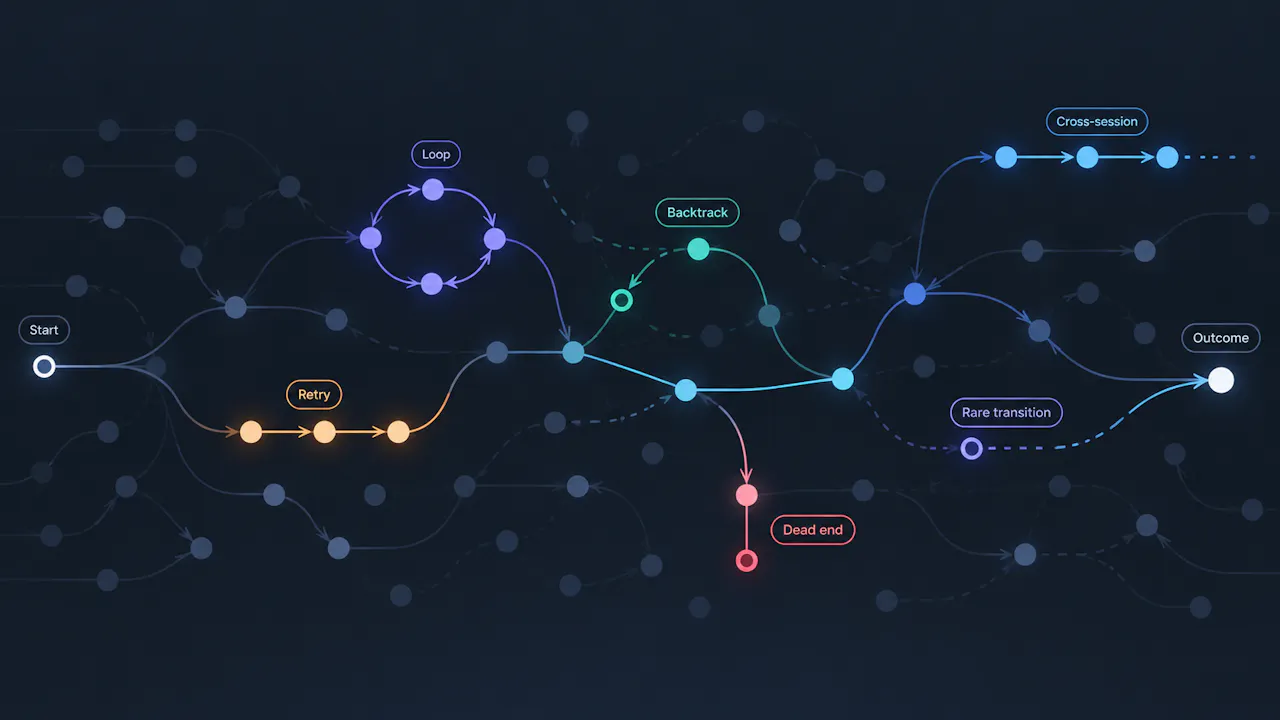
Patterns are evidence, not intent
Events aren’t behavior. Three clicks on Save are three events. They may also be one behaviour: a retry. Likewise, Paywall → Close → Paywall → Close is not simply four events. It may be a loop worth investigating.
That is the gap between collecting event data and understanding user behaviour. Product analytics can tell you that an action happened. The harder question is what the sequence around that action reveals, and whether the same structure appears across sessions, users, cohorts, releases or outcomes.
An event is an observation. A pattern is a relationship among observations.
That distinction is at the heart of user behavior analytics. Instead of looking only at clicks, page views, searches or purchases, you can examine how user interactions connect, repeat, change direction and eventually lead to completion, abandonment or another outcome. Here’s an in-depth look at 12 practical user behavior patterns that can hide between product events.
The 12 patterns at a glance
# | Pattern | Class | Signature | What to investigate |
1 | Retry | Behavioural shape | Same action repeated | Did the expected state change? |
2 | Loop | Behavioural shape | Same states repeat | Is the user making progress? |
3 | Backtracking | Behavioural shape | Forward → back → forward | Is the reversal normal or associated with friction? |
4 | Repeated attempt | Behavioural shape | Different actions, same goal | Are users trying multiple routes to accomplish the same task? |
5 | Recovery | Behavioural shape | Failure → workaround → success | Are successful users exposing a broken primary path? |
6 | Dead end | Behavioural shape | Action → no progress → exit | Where does the journey lose momentum? |
7 | Cross-session recurrence | Recurrence | Similar behaviour appears in later sessions | Is the problem persistent? |
8 | Near-match recurrence | Recurrence | Different paths, similar structure | Are users reaching the same behavioural state by different routes? |
9 | Rare transition | Distribution and change | Unusual transition becomes common | What changed around the transition? |
10 | Cohort concentration | Distribution and change | Pattern clusters in one group | Is an average hiding a segment-specific problem? |
11 | Temporal emergence | Distribution and change | Pattern changes around a time boundary | Did behaviour change after a release or experiment? |
12 | Outcome-discriminative pattern | Outcome | Pattern differs between outcome groups | Does the behaviour help prioritise investigation? |
Patterns are evidence, not intent. A loop does not automatically mean confusion, and a correlation with conversion does not establish causation.
The Tugboat Behavioral Pattern Framework
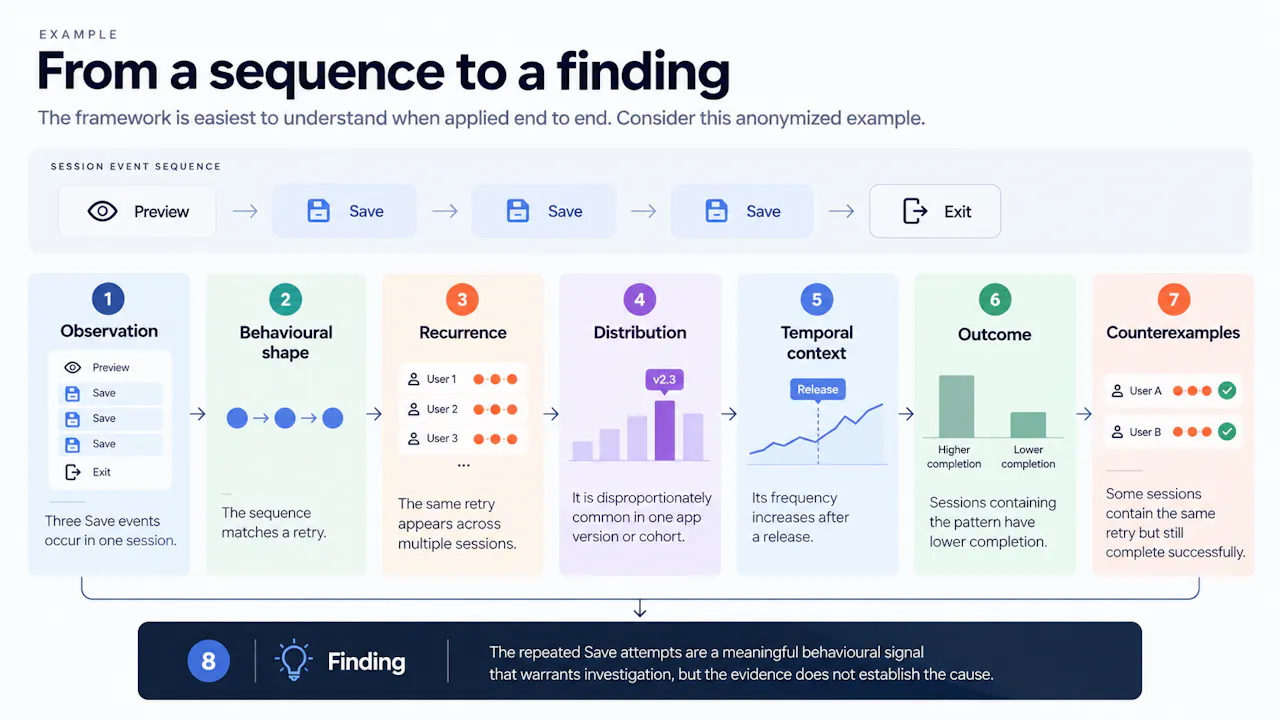
We use four dimensions to investigate recurring behaviour:
- Shape - what structure occurred?
- Recurrence - does it happen again?
- Distribution - where and when does it concentrate?
- Outcome - what happens around it?
- + Counterexamples - what evidence argues against the finding?
A sequence becomes interesting when it repeats. A repeated pattern becomes useful when it concentrates, changes, or relates to an outcome.
Three principles for interpreting behavioral patterns
- Patterns are evidence, not intent.
- Counterexamples strengthen an investigation.
- Outcome discrimination is prioritization evidence, not causal evidence.
The aim is not to infer what users were thinking from a click. It is to build enough evidence around recurring behaviour to decide whether it deserves investigation.
From event to finding
A useful behavioural signal doesn't stop at the event itself.
Event
↓
Behavioural shape
↓
Recurrence
↓
Cohort / time context
↓
Outcome
↓
Counterexamples
↓
Finding
For example, a single Save → Save sequence is an observation. If that retry keeps appearing across sessions, concentrates on one app version, emerges after a release, and is associated with abandonment, it becomes a much stronger finding worth investigating.
Patterns are not conclusions. The evidence around a pattern is what makes it useful.
Why individual events miss behavioural structure
Product analytics is excellent at answering questions over events: usage, funnels, cohorts, retention and paths. But important behaviour can exist in the relationships between those events, especially when the same structure recurs across sessions.
Metrics such as active users, stickiness and feature adoption can show whether overall product usage is healthy while individual users still encounter friction.
Heatmaps and session recordings add context, while interaction analytics and signals such as rage clicks can highlight specific interactions. But the harder question is whether the same behavioural structure keeps appearing across sessions, cohorts or user journeys. That is where user behavior analytics becomes useful.
A note about “user behavior analytics”
In product teams, user behavior analytics generally refers to analysing how people interact with a website, app or digital product. This article focuses on product usage, behavioural patterns, user journeys and outcomes rather than cybersecurity-focused UEBA.
12 user behavior patterns hidden between product events
There is no single universal taxonomy for user behavior analytics patterns. The framework below is intended as a practical way to recognise recurring structures in event sequences, user journeys and session data.
1. Retry: the same action happens again
Signature: A → A → A
Retry is a repeated attempt to perform the same action when the expected product state has not clearly changed. Save → Save → Save. The sequence is interesting, but the repeated click isn't necessarily a problem. You can also assume that some interfaces take time to respond. Some users double-click. Some actions are deliberately repeatable.
However, the useful question here is what happened between the attempts. If the first Save produced a visible state change and the second click followed immediately, there may be nothing wrong. If the interface stayed unchanged, an error appeared or the user kept trying before eventually abandoning the task, the sequence becomes more meaningful.
Timing matters too. Three clicks over ten seconds tell you something different from three clicks spread over ten minutes. The same pattern appearing across hundreds of sessions is also more useful than one unusual session.
The useful signal isn't the second click. It's what happened between the first and second click.
2. Loop: users keep returning to the same states
Signature: A → B → A → B
A loop occurs when users repeatedly move between the same states without making meaningful progress. Paywall → Close → Paywall → Close. Or Settings → Feature → Settings → Feature.
A single return to a previous screen is normal. Repeated movement between the same states is more interesting, particularly when it happens several times in a short period.
You don't need to decide why the loop occurred from the sequence alone. Compare looping sessions with sessions that complete the same task without looping. If looping users take longer, abandon more often or show the pattern at the same point in a journey, the transition deserves investigation.
3. Backtracking: users move forward, then go back
Signature: A → B → C → B → C
Backtracking happens when a user moves forward through a workflow, returns to an earlier step and then continues forward again. A checkout might look like Address → Payment → Address → Payment.
That isn't automatically friction. A user may have realised they need to check their address or noticed an error. Backtracking becomes more interesting when it repeatedly happens at the same step, adds significant time or is associated with lower completion.
Compare users who backtrack with those who move directly through the same workflow. Look at completion rate, time-to-completion and abandonment.
4. Repeated attempts: different actions, same goal
Signature: Different actions → apparently same task
Users don't always repeat the same event when they're struggling. They may try several controls, routes or features while working towards the same goal. Search → Filter → Search → Sort → Search.
Each event is different, but the underlying behaviour may be the same: the user is trying to find something.
Repeated attempts can indicate that the obvious route isn't working or that the product isn't making the next step clear. But exploration can look similar. An experienced user may deliberately try different controls.
Task equivalence should be inferred from product state and context, not assumed from the events alone.
5. Recovery: users find another route after failure
Signature: Failure → workaround → success
Recovery patterns can expose friction that conventional conversion metrics miss. The user eventually succeeds, so they don't appear as a lost conversion. Yet they may have encountered a broken or confusing primary path.
Let’s say a user’s payment gets declined. The user then uses a different card to pay and the payment goes through. Here, the user has encountered an obstacle, changes their behavior, and eventually pulls through.
This is why successful users can be just as useful for behavioral analysis as unsuccessful users. If hundreds of people encounter the same failure and independently follow the same workaround, you've found a potential map of the friction. The workaround shows how users are compensating for something the product isn't handling well.
A single recovery isn't enough to establish a pattern. Start with a failure event, inspect the next few actions and compare the paths of users who recover with those who abandon.
6. Dead end: an action leads nowhere
Signature: Meaningful action → no progress → exit
A dead end is when a user performs a meaningful action and then stops without reaching another useful product state. For example: Feature Opened → Action → No Activity → Session Ended.
This can happen when a control doesn't respond, the next step isn't clear, feedback is missing or the feature doesn't behave as expected. Inactivity isn't automatically abandonment. People get interrupted, switch tabs or stop using a product for unrelated reasons.
Look for the pattern across many users and compare it with normal session behaviour. Segment it by device, app version or entry point to see whether the dead end is concentrated somewhere specific.
7. Cross-session recurrence: the same behaviour keeps coming back
Signature: Similar episode → later session → similar episode again
Some behavioural patterns don't make sense when sessions are analysed independently. Imagine this:
- Monday: A user opens a feature, tries an action, fails and leaves.
- Tuesday: They return and try the same thing again.
- Wednesday: They come back once more and finally find a workaround.
Three separate sessions might look ordinary in standard session analysis. Connected together, they tell a much more interesting story. Cross-session recurrence can reveal persistent friction that a single session cannot. It can show that a user is repeatedly trying to accomplish something the product isn't making easy.
The pattern becomes stronger when the same episode occurs across several sessions or appears among many users. A repeated action within one session is a retry. The defining feature here is the gap between sessions.
Investigating this properly requires a reliable way to connect sessions to users while respecting privacy. Once those sessions can be connected, product teams can look for recurring failures, repeated workarounds and unresolved journeys.
8. Near-match recurrence: similar behaviour takes different paths
Signature: Different sequences → similar behavioural structure
Not every user has an identical journey. One user might follow Zoom → Inspect → Regenerate. Another might follow Preview → Inspect → Change → Regenerate. The exact paths differ, but both may represent the same broad behaviour: inspect a result, decide it isn't right and attempt another version.
A near-match pattern is useful when several event sequences contain a similar structure without being identical. This is one of the harder forms of behavioural analysis to perform manually at scale because the analyst has to recognise structure rather than simply match exact paths.
The caution is that similar events don't necessarily mean similar intent. The surrounding session context still matters.
9. Rare transition: an unusual path suddenly becomes common
Signature: Rare transition → sustained increase
Some transitions are unusual until something changes. Suppose Preview → Settings historically appears in only a small fraction of sessions. Then, after a product change, it suddenly appears in 18% of sessions.
The transition itself doesn't tell you what happened. The change in its frequency gives you the reason to investigate. Possible explanations include a new feature, interface redesign, release, experiment or change in the way users enter the product. It could also be completely unrelated.
The first thing to check is whether the increase is real. A small user population can turn a handful of additional sessions into a dramatic percentage change. Look at absolute user counts as well as rates, then compare the transition over several days or weeks. If the increase persists, line it up against the release calendar and A/B testing schedule.
10. Cohort concentration: averages can hide the problem
Signature: Pattern occurs disproportionately in one cohort
A behavioural problem can disappear inside an overall average. Suppose 5% of users experience a Save → Retry → Abandon sequence. That might seem relatively small. But if the pattern occurs in 30% of an important device or app-version cohort, the problem looks very different.
Break the pattern down by operating system, device, app version, subscription plan, geography or acquisition source.
Cohort concentration doesn't prove that the cohort caused the issue. The useful question is not simply who behaves differently, but how they behave differently and what else they have in common.
11. Temporal emergence: behaviour changes after a product change
Signature: Pattern changes around a specific time boundary
For months, users might rarely backtrack on a particular screen. Then version 7.14 ships and the pattern becomes common. That is temporal emergence. It can provide an early warning of a regression that doesn't produce a technical error. The application continues to work, but the way users interact with it changes.
Timing is useful evidence, but it isn't proof of causation. A release can coincide with other changes in the product or traffic. Start by comparing behaviour before and after the relevant date. Then check release notes, experiment schedules, backend changes and traffic sources.
If the behavioural change is tightly aligned with a release and persists afterwards, you've got a much stronger lead for the product and engineering teams to investigate.
This is one of the most useful applications of user behavior analytics because a regression doesn't always show up in error monitoring. Sometimes users tell you something is wrong through the way they navigate the product.
12. Outcome-discriminative patterns: successful and unsuccessful users behave differently
Signature: Pattern prevalence differs between outcome groups
A behavioural pattern becomes more interesting when it separates users who complete a goal from those who don't. Imagine that sessions containing a particular recovery sequence have a 61% completion rate, while sessions containing a particular dead-end sequence have a 3% completion rate.
That's useful prioritisation evidence. It isn't proof that the dead end caused the lower completion rate. Other factors could contribute to the difference. Outcome discrimination is prioritisation evidence, not causal evidence.
Compare sessions that contain the pattern with those that don't, then repeat the comparison across relevant cohorts and time periods.
Where Tugboat fits
Product teams already use tools such as Amplitude, Mixpanel and PostHog for product analytics, funnels, cohorts and path analysis. Other tools provide code, error and system context.
Tugboat starts with the sessions underneath your metrics and looks for recurring behavioral structure across them. A funnel answers a known question about a defined journey; a path shows a route you already want to understand.
That is especially useful for near-match recurrence, cross-session recurrence and patterns that emerge across cohorts, time or outcomes. Everything here can be investigated manually, but doing that across thousands of sessions doesn't scale.
Tugboat helps surface recurring behaviour and unusual sequences so product teams have concrete evidence to investigate. The question shifts from “What event happened?” to “What did users actually do, and what pattern does that behaviour reveal?”
Conclusion
Product analytics gives teams the events they need to understand what happened. User behavior analytics adds context by connecting individual actions into sequences and sequences into patterns.
Good user behavior analysis moves from observation to evidence: find the behavioural shape, check whether it recurs, examine where and when it appears, compare outcomes and test counterexamples.
That is the behavioural layer Tugboat is designed to help product teams investigate. Because an event can tell you that something happened. The pattern between the events can tell you what was happening.
Frequently asked questions
Can a retry be detected from events alone?+
An event sequence can identify a potential retry, such as Save → Save → Save, but the sequence alone cannot establish why the action was repeated. The product state, timing, surrounding events and eventual outcome provide the context needed to determine whether the pattern is worth investigating.
How is a behavioral loop different from a rage click?+
A rage click usually describes rapid repeated interaction with the same element. A behavioral loop is broader: it describes repeated movement between states or steps, such as Paywall → Close → Paywall → Close. A rage click can be one signal within a larger behavioural pattern, but the two are not interchangeable.
How many sessions are needed before something becomes a pattern?+
There is no universal threshold. A pattern becomes more meaningful when it recurs often enough to distinguish it from an isolated session and remains visible when you examine relevant cohorts or time periods. The appropriate threshold depends on the product, traffic volume and behaviour being studied.
Can behavioral patterns prove why users abandoned?+
No. Behavioural patterns can provide evidence that helps explain what happened before abandonment, but they do not automatically establish causation. A retry, loop or dead end may be associated with abandonment without causing it. Comparing outcomes, cohorts, time periods and counterexamples can make an investigation stronger.
What's the difference between path analysis and behavioral pattern discovery?+
Path analysis examines routes through a product, usually around a journey or sequence that a team already wants to understand. Behavioral pattern discovery starts more broadly by looking for recurring structures across sessions, including patterns that may not have been defined in advance.
What are the main types of user behavior patterns?+
They generally fall into four core categories:
- In-session shapes: Structural interactions such as retries, loops, backtracking, workarounds and dead ends.
- Recurrence: Similar sequences appearing across multiple sessions or through slightly different navigation paths.
- Distribution and shifts: Behavioural changes tied to an app release, time boundary or specific cohort.
- Outcome links: Behaviours that differ between users who complete a goal and those who abandon.
What is the difference between user behavior analytics and product analytics?+
Product analytics provides high-level population metrics such as active users, conversion funnels, retention cohorts and feature adoption rates. User behavior analytics works alongside product analytics by examining the relationships between individual events. Product analytics can show where users are dropping off in a funnel. Behavioural analysis can help show what users were doing around the point where they dropped off.