
How to Detect a Product Regression Before Your KPI Moves
Users often behave differently before a KPI moves. Here's how to spot those signals after a release and tell them apart from noise.
 By Simra Sadaf · Content Writer9 sections
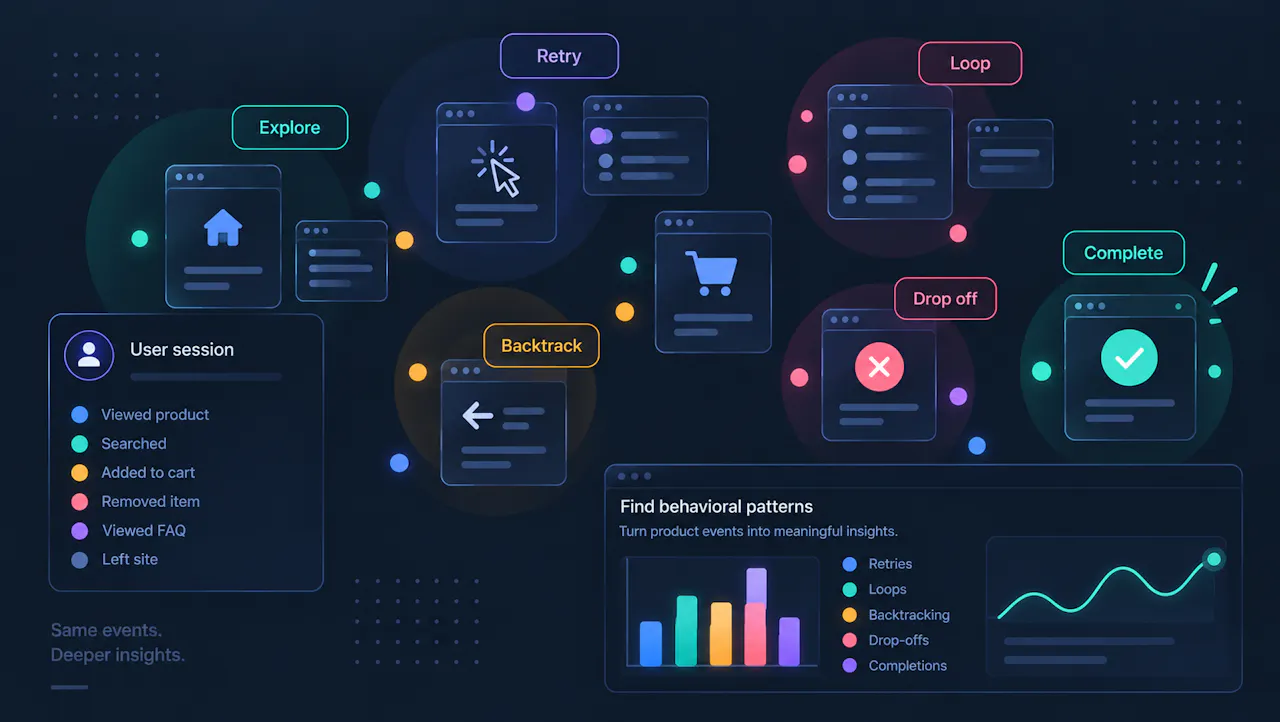
A product regression doesn't always start with a falling KPI. Sometimes, users behave differently first. They retry an action, backtrack through a workflow, take longer to complete a task, or abandon a step they previously completed.
Product analytics can show you when conversion, activation, retention, or other product metrics change. But because these are aggregate outcomes, a regression affecting a smaller population may not move them immediately. Behavioral analytics can sometimes surface those changes earlier by showing how users interact with the product, not just the outcome they eventually produce.
The difficult part isn't spotting unusual behavior. Modern products generate plenty of unusual behavior. The harder question is whether something actually changed after a release and whether that change is meaningful enough to investigate.
This article explains how product analytics teams can identify meaningful behavioral signals, distinguish them from normal variation, and connect them to the evidence needed for release monitoring and root-cause investigation.
Note: Here, product regression means a software regression in which a previously working product behavior, feature, or workflow becomes worse after a change or release. It does not refer to statistical regression.
What Is a Behavioral Leading Indicator?
A behavioral leading indicator is a recurring change in how users interact with a product that can appear before, or independently of, a measurable change in an aggregate product metric. The distinction matters because a KPI tells you that an outcome changed. It doesn't necessarily tell you what users were doing before that outcome changed.
A user who normally completes a workflow in four steps might suddenly start retrying an action, moving backward through the workflow, or taking twice as long to finish it. If enough users behave this way, that change may be worth investigating even if the headline KPI still looks normal.
The Conventional Way Teams Detect Product Regressions
The traditional approach usually starts with a product metric. A team ships a release, watches its dashboards, and waits for an important KPI to move outside its expected range. If conversion, activation, retention, feature adoption, or another product health metric changes, someone starts investigating.
That investigation often moves across several systems. A product manager might segment the metric by platform, browser, geography, customer type, or cohort. They may open session replays to understand what affected users experienced, check error tracking for technical evidence, and inspect the release to determine what changed.
This workflow is useful. Product analytics establishes the outcome, behavioral data provides context, and engineering systems can help establish a technical cause. The limitation is where the investigation begins: the KPI has to move enough to get someone's attention.
What Product Analytics Is Good At
Product analytics is excellent at measuring outcomes at scale. It helps teams understand funnels, feature adoption, workflow completion, engagement, retention, and other important product metrics. Those measurements are essential.
If checkout conversion drops, for example, product analytics can show where the drop occurred and which segments are affected. What it may not show is whether users encountered a broken button, became confused by a new step, experienced an error, or started taking a different route through the workflow. That requires moving closer to the underlying user behavior.
Where Aggregate Metrics Can Lag
Imagine a product with 100,000 weekly users. A new release introduces a problem affecting 1,000 of them. For those users, the experience may change dramatically: they repeatedly attempt an action, take longer to complete a workflow, or abandon it altogether.
But if the affected users represent a relatively small share of the total population, the aggregate KPI may not move enough to trigger an investigation. The metric isn't wrong. It is measuring something different.
A KPI tells you how an outcome is changing across the population. Behavioral analysis can sometimes show how the underlying user experience is changing before the aggregate outcome becomes obvious.
That makes behavioral signals particularly interesting during release monitoring, when teams are trying to understand whether a recent change has altered how users interact with the product.
Behavior Can Change Before the Metric Does
An individual event provides limited context. If a user clicks a Save button, the event tells you that the action happened. It doesn't tell you whether the action worked, whether the user understood the result, or whether they had to try again.
Consider this sequence:
Save → wait → Save → navigate away → return → Save
Individually, those actions aren't particularly alarming. The interesting part is the relationship between them. The user tried the same action repeatedly, left the screen, came back, and tried again.
This is where behavioral analytics becomes more useful than simple event counting. A product can generate millions of events, but the meaningful signal may exist in the sequence connecting those events.
Events vs. Behavioral Patterns
Events | Behavioral patterns |
Tell you what happened. | Show you what users are repeatedly doing. |
Focus on individual actions. | Look at sequences and relationships between actions. |
A user clicks Save. | A user clicks Save → waits → clicks Save again → leaves → returns → clicks Save. |
One unusual event may mean very little. | A recurring sequence across many users can reveal a meaningful change. |
Useful for measuring specific actions and outcomes. | Useful for identifying friction, retries, loops, backtracking, and abandonment patterns. |
An event doesn't necessarily explain why behavior changed. | A behavioral pattern can provide a hypothesis about what may have changed. |
A single unusual session doesn't establish a regression. The user may simply have made a mistake. But if the same sequence was almost nonexistent before a release and starts appearing across hundreds of sessions afterward, it becomes a behavioral signal worth investigating.
This is also where anomaly detection and regression detection diverge. An anomaly is behavior that differs from an expected pattern. A product regression is a deterioration in previously working behavior following a change. An anomaly can prompt an investigation, but it isn't proof of a regression.
For Tugboat, the opportunity is to go beyond finding unusual sessions and identify recurring behavioral patterns, then put those patterns in the context of releases, cohorts, and outcomes.
What Behavioral Signals Can Reveal a Regression?
A useful behavioral signal is rarely a single unusual event. It is usually a pattern whose frequency, sequence, or distribution has changed.
Behavioral signal | What it may indicate |
Repeated clicks | An action may not be responding or confirming clearly |
Repeated retries | An operation may be failing, timing out, or providing unclear feedback |
Navigation loops | Users may be unable to determine how to progress |
Increased backtracking | A new step may have introduced friction or confusion |
Longer completion times | A previously simple workflow may have become harder |
New abandonment points | A particular step may be creating unexpected friction |
New action sequences | Users may be adapting to an unexpected product change |
Errors followed by retries | A technical problem may be affecting a workflow |
Sudden feature-usage changes | A release may have affected discoverability, usability, or reliability |
None of these behaviors automatically indicates a regression. What matters is whether the change is persistent enough to be meaningful and whether there is enough surrounding evidence to justify investigation.
How to Tell a Behavioral Signal From Noise
Modern products generate plenty of unusual behavior. A user can click twice because they misclicked, return to a previous screen because they forgot something, or abandon a workflow simply because they got distracted.
The first question, therefore, isn't "Is this behavior unusual?" It's "Is this behavior meaningfully different from normal product usage?". The below six factors help answer that question:
1. Recurrence
A single unusual session is weak evidence. If a similar sequence appears across many independent users or sessions, it becomes more interesting.
Recurrence doesn't require every user to follow the exact same path. A few different sequences can still represent the same underlying behavioral pattern. What matters is whether the structure keeps showing up.
2. Baseline
Every behavioral signal needs a reference point. A retry that has always occurred occasionally isn't necessarily interesting. A retry rate that jumps after a release is. Baseline comparison turns a subjective observation into something measurable: how different is this behavior from what normally happens?
3. Population
The next question is who is experiencing the change. A pattern might be concentrated among users on a particular app version, browser, platform, customer tier, geographic region, or cohort.
That context can significantly narrow an investigation. A problem that appears almost exclusively among users on one version points the team in a very different direction from a pattern appearing across the entire customer base.
4. Timing
Timing adds another useful layer. A behavioral pattern that has existed for six months is different from one that first appears shortly after a release.
That doesn't prove the release caused the change. Other factors may have changed at the same time, including experiments, traffic, infrastructure, or seasonality. The useful conclusion is simply that the release is worth investigating.
5. Outcome
A behavioral pattern becomes more actionable when it connects to an outcome. If users who repeatedly retry an action are also significantly less likely to complete the workflow, that gives the team a stronger reason to investigate.
The relationship still isn't proof of causality. It establishes that the behavioral change is associated with something the product team already cares about.
6. Technical evidence
Finally, behavioral evidence can be compared with technical evidence such as application errors, API failures, network problems, performance degradation, logs, traces, or a relevant code change.
None of these factors proves a regression on its own. Together, however, they can turn "something looks unusual" into a much more specific investigation.
How to Analyze a Release for Behavioral Regression
Once a behavioral signal looks meaningful, the next step is to put it in the context of the release.
Start with the behavior before deployment. Was the pattern already present? If so, how often? Then look at when the behavior changed and whether the change is concentrated in a particular population.
From there, connect the behavioral change to the outcome the team cares about. If users exhibiting the new pattern are also less likely to complete the workflow, that gives the team a useful direction for investigation. Technical evidence can then help determine whether there is a corresponding application, API, network, or performance issue.
The important point is that this is an investigation process, not a causal shortcut. A behavior changing after a release doesn't prove that the release caused it. It tells the team where to look.
A Practical Release Analysis Framework
A useful release analysis should answer a simple sequence of questions:
What changed? → Was it recurring? → Was it different from baseline? → Who experienced it? → When did it appear? → Did it matter to an outcome? → Is there technical evidence?
You don't need every answer before investigating. In practice, an early behavioral signal may be enough to start looking at the affected sessions or release. The additional context helps determine whether the signal is worth escalating.
For Tugboat, this is where behavioral pattern discovery becomes useful: surfacing recurring changes that might otherwise remain buried inside thousands of individual sessions.
How a Product Regression Investigation Might Unfold
Consider a team that has just released a new checkout flow. Conversion looks normal for the first few hours, so there is no obvious KPI problem. However, session data shows users repeatedly attempting payment:
Payment → wait → Payment → wait → Payment → exit
The team doesn't immediately label this a regression. Instead, it asks whether this sequence was common before the release, whether it is concentrated among users on the new version, and whether these users are less likely to complete checkout.
If the pattern is new, recurring, concentrated among users on the new release, and associated with lower completion, it becomes a stronger lead. If payment errors or API failures also appear around the same sessions, the engineering investigation has another piece of evidence to work with.
And if the same behavior existed at roughly the same frequency before the release, the release becomes a much less compelling explanation.
That's the practical difference between detecting an anomaly and investigating a regression. The system doesn't need to declare "this release broke checkout." It needs to surface enough evidence for the team to decide what deserves attention.
What a Useful Behavioral Regression Detector Should Do
A useful regression detector shouldn't simply flag unusual behavior. It should reduce the amount of manual work required to understand whether that behavior matters.
At a minimum, it should be able to recognize recurring behavioral structures, compare them with historical usage, identify where they are concentrated, and place them alongside relevant release and outcome data. When technical evidence is available, it should make that connection easier to investigate as well.
The important distinction is between an alert and an investigation-ready signal. "Retry behavior increased" is an observation. "Retry behavior increased after version X, is concentrated among users on that version, and is associated with lower checkout completion" gives a product team somewhere useful to start.
That is a much more practical goal than simply generating more anomaly alerts.
When Behavioral Signals Actually Help — and When They Don't
Behavioral signals can act as leading indicators, but not in every regression. They are particularly useful when a regression changes how users interact with a workflow. A retry, loop, backtracking pattern, longer workflow, or new abandonment point can reveal friction before the aggregate impact becomes large enough to show up in a KPI.
There are also situations where the KPI will be the faster signal. A backend outage affecting almost everyone can cause conversion or completion to drop immediately. A problem affecting only a handful of users may not produce enough recurring behavior to establish a reliable pattern. Some issues may also occur outside the observable interaction layer.
Behavior can change for legitimate reasons, too. Seasonality, a new acquisition channel, a marketing campaign, an experiment, or a product improvement can all alter user behavior without anything being broken.
So behavioral anomaly detection shouldn't be treated as automatic regression detection. Its value is as another observation layer: one that can sometimes reveal a change in user behavior while the aggregate impact is still developing.
The Post-Ship Workflow
The traditional post-release workflow often looks like:
Ship → Wait → KPI changes → Segment metric → Open replays → Check errors → Inspect release → Investigate
A behavior-aware workflow adds another observation point:
Ship → Establish behavioral baseline → Observe behavior changes → Investigate recurring patterns → Connect them to the release and affected users → Check outcomes and technical evidence
The second workflow doesn't replace product analytics, dashboards, experiments, session replay, or engineering tools. It changes where the investigation can begin.
Instead of waiting for a KPI to become sufficiently abnormal, teams can sometimes start with a recurring behavioral pattern and then use their existing tools to work out what changed.
What Product Teams Should Check After a Release
A post-release review shouldn't stop at the headline KPI. Teams should also ask whether users are interacting with the product differently from before.
Look at recurring retries, navigation loops, backtracking, longer completion times, new abandonment points, and unexpected changes in feature usage. Compare those patterns with the pre-release baseline and see whether they are concentrated in a particular version, platform, cohort, or other population.
Then check the surrounding evidence. Did the pattern begin after the release? Does it correspond with a change in completion, conversion, activation, or abandonment? Are there errors, API failures, performance issues, or recent code changes that support the investigation? If the pattern appears meaningful, use representative session replays to see whether the behavior can be reproduced or understood in context.
Finally, check the KPI. If it has moved, the behavioral pattern may help explain why. If it hasn't, the pattern may still be worth investigating if it is growing or becoming more concentrated.
Where Tugboat Fits
Product teams already use tools for product analytics, funnels, cohorts, path analysis, session replay, and engineering telemetry. These tools are valuable, but they generally answer questions the team already knows to ask.
Tugboat starts closer to the sessions underneath those metrics. It looks for recurring behavioral structure and changes in how users interact with a product, then surfaces patterns that may deserve investigation.
That can be particularly useful when the relevant behavior wasn't defined as an event or funnel ahead of time. Instead of asking only "Did users complete the checkout funnel?", a team can investigate whether users started retrying payment, looping between screens, or taking an unexpected route through the workflow.
The goal isn't to replace product analytics or existing engineering tools. It's to make the behavioral evidence between the events easier to find and investigate.
Conclusion
Product analytics tells teams what happened at the aggregate level. Behavioral analytics adds another layer by showing how users interacted with the product along the way.
A meaningful behavioral signal isn't simply an unusual event. It is a recurring change that can be compared with a baseline, understood in context, and connected to outcomes or technical evidence.
That gives teams another way to spot potential product regressions before their impact is obvious in a KPI. And for Tugboat, that's the opportunity: help product teams find the behavioral patterns worth investigating before they get buried in the event data.
FAQs
What is product regression detection?+
Product regression detection is the process of identifying when a previously working product behavior, feature, or workflow becomes worse after a release or other change. Product analytics can reveal changes in aggregate metrics, while behavioral analytics can help identify changes in how users interact with the product.
Can behavioral analytics detect a product regression before a KPI changes?+
Sometimes. If a regression affects a relatively small population, the aggregate KPI may not move immediately. A recurring behavioral change, such as increased retries, backtracking, loops, or abandonment can provide an earlier signal that something may have changed. It does not, however, prove that a regression occurred.
What behavioral patterns can indicate a product regression?+
Common signals include repeated clicks or retries, navigation loops, increased backtracking, longer completion times, new abandonment points, unexpected action sequences, and sudden changes in feature usage. The pattern becomes more useful when it differs from its historical baseline and can be connected to a relevant population, outcome, or technical evidence.
What is the difference between anomaly detection and regression detection?+
Anomaly detection identifies behavior that differs from an expected pattern. Regression detection focuses on deterioration in previously working product behavior, typically following a release or other change. An anomaly can be a reason to investigate a potential regression, but an anomaly alone does not establish that a regression occurred.
How can product teams tell whether a behavioral change is meaningful?+
Teams can compare the behavior with its historical baseline, check whether it recurs across users or sessions, identify the affected population, examine when the change appeared, and look for relationships with product outcomes or technical evidence. No single signal proves causality; the combination provides a stronger basis for investigation.
How does product analytics help with regression detection?+
Product analytics helps teams monitor aggregate outcomes such as conversion, activation, retention, feature adoption, and workflow completion. These metrics can reveal that something changed, while behavioral analytics can provide additional context about what users were doing around the change. This combination is useful because product analytics and behavioral analysis answer different parts of the investigation.